- The Barwon-Darling region naturally goes through wetting and drying cycles that can last decades.
- We are currently going through a dry period. The last dry period was 1900 – 1950.
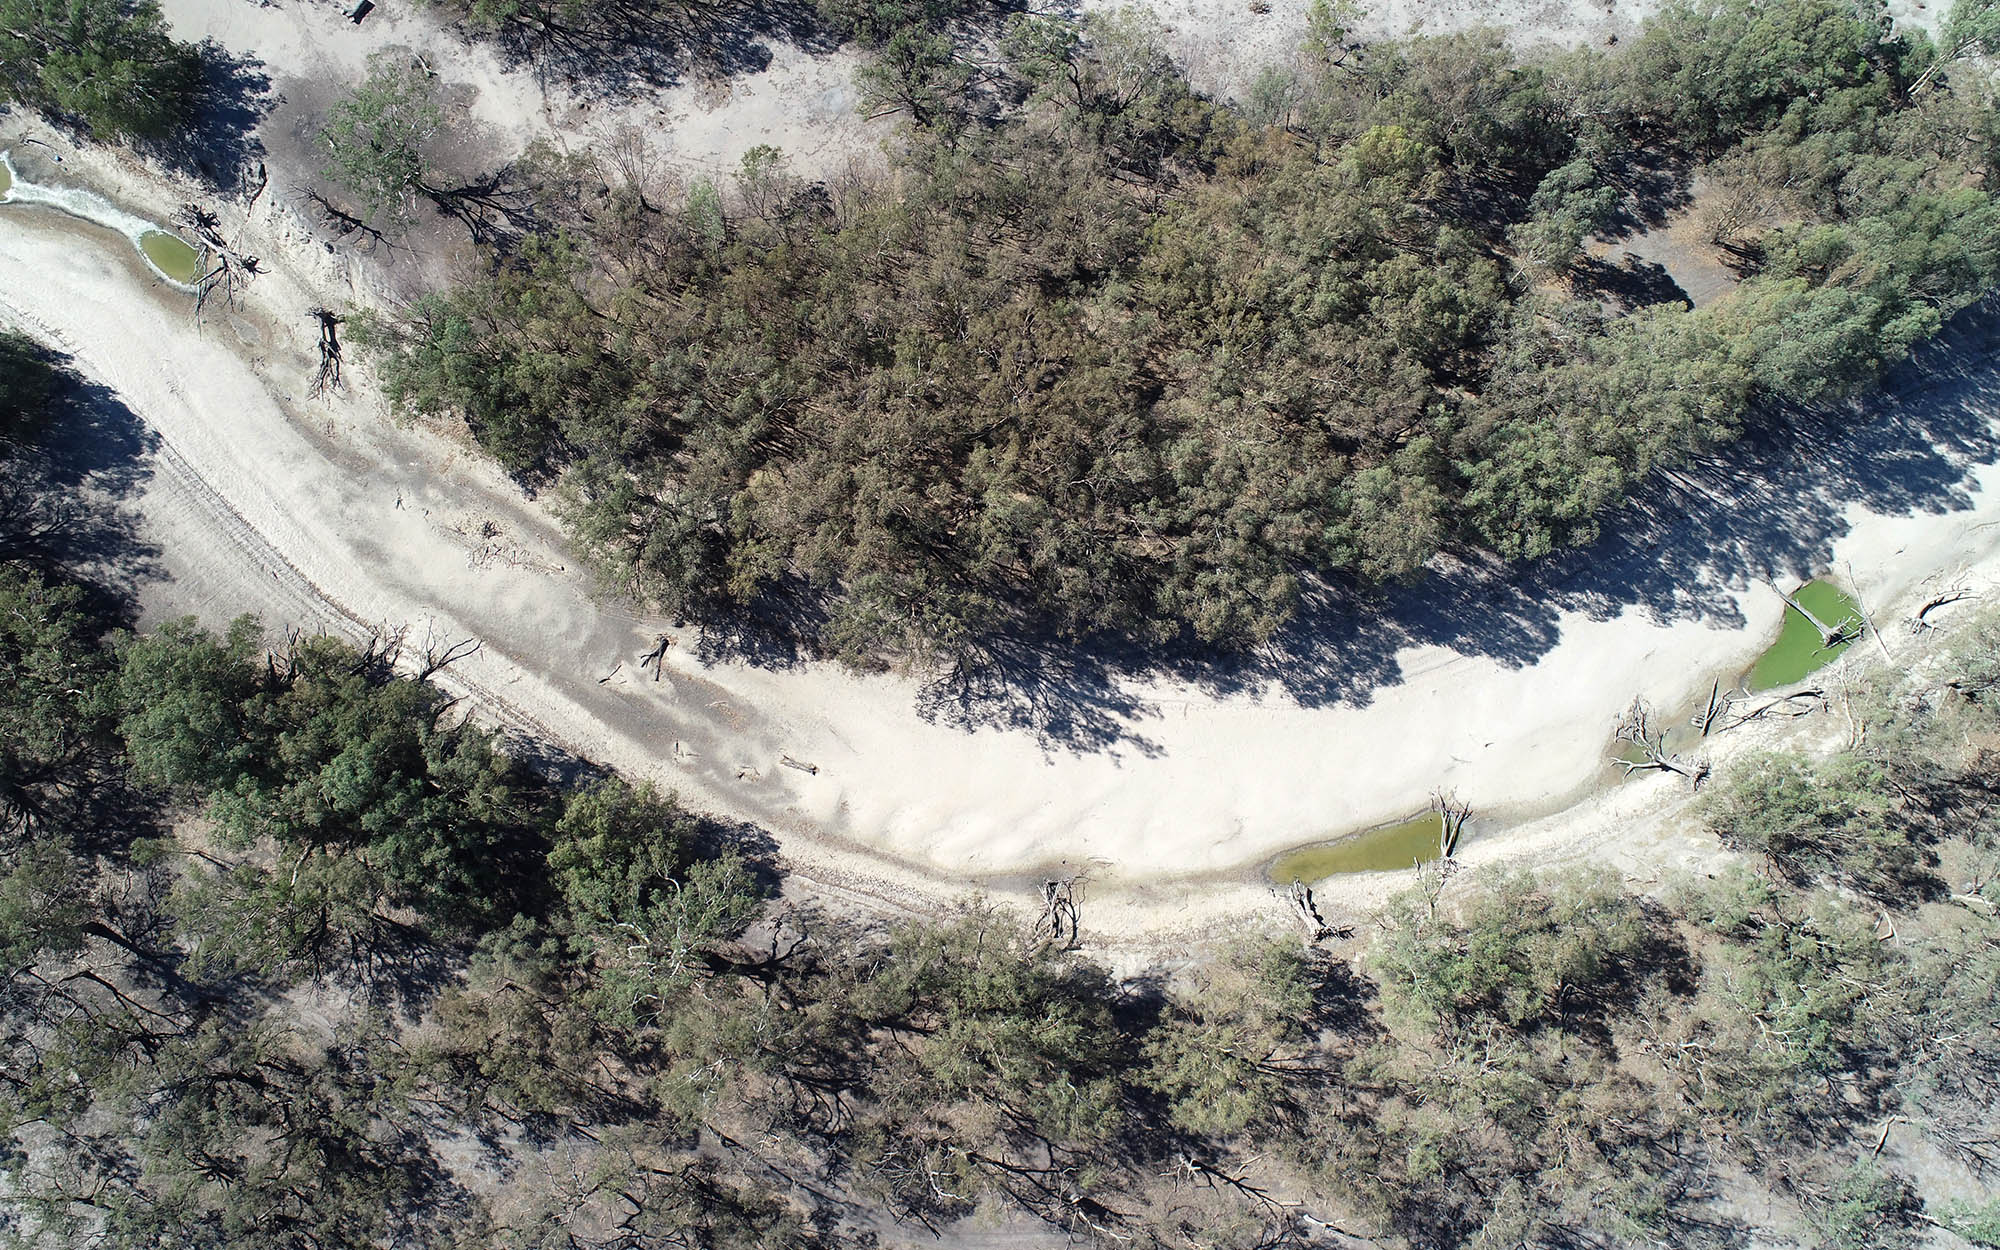
- The cease to flow periods experienced in the most recent drought have been long and severe, but are not unusual when compared to conditions in historical dry periods.
- There are clear differences between the cease to flow periods in the dry, compared to the wet periods.
Climate cycles
The NSW Government has collected rainfall data for approximately 130 years. This data helps us begin to understand some of the long term climate trends in the region. The north-western region of NSW cycles between wet and dry cycles with each cycle lasting decades:
-
1900s – 1950
Comparatively dry period
-
1950 – 2000
Comparatively wet period
-
Post 2000
A return to comparatively dry periods
The driest 10-year and 5-year droughts in all northern valleys and the western region have all occurred during the dry periods.
Cease-to-flow periods
The Barwon-Darling river has often stopped flowing for periods of time. The cease to flow periods in the dry periods of our climate are more frequent than in the wet period.
The cease to flow conditions we saw in the most recent drought were severe and had significant impacts on communities, ecosystems and industries, but they are not unique when compared to the historical record. Our lived experience is mostly drawn from the wet period when there were very few cease to flow periods.
For this analysis we have used the plain English definition of cease to flow which is zero recorded flow.
Graphs
Barwon-Darling
The graph below shows the number of cease to flow days per year across different points in the Barwon-Darling river.

Walgett

| Period | Average number of cease | Average duration of cease to flow periods | Duration of longest cease to flow period |
|---|---|---|---|
| 1900 – 1950 | 0.5 | 50 days | 270 days |
| 1950 – 2000 | 0.1 | 60 days | 156 days |
| 2000 – 2021 | 0.7 | 42 days | 326 days |
Brewarrina

| Period | Average number of cease | Average duration of cease to flow periods | Duration of longest cease to flow period |
|---|---|---|---|
| 1900 – 1950 | 0.54 | 51 days | 296 days |
| 1950 – 2000 | 0.02 | 127 days | 127 days* |
| 2000 – 2021 | 0.15 | 74 days | 114 days |
* this occurred July – November 1995
Wilcannia

| Period | Average number of cease | Average duration of cease to flow periods | Duration of longest cease to flow period |
|---|---|---|---|
| 1900 – 1950 | 0.44 | 66 days | 130 days |
| 1950 – 2000 | 0.16 | 34 days | 80 days |
| 2000 – 2021 | 0.64 | 104 days | 309 days |
Weir 32

| Period | Average number of cease | Average duration of cease to flow periods | Duration of longest cease to flow period |
|---|---|---|---|
| 1900 – 1950 | 0.6 | 66 days | 263 days |
| 1950 – 2000 | 0.06 | 3 days | 4 days |
| 2000 – 2021 | 0.5 | 32 days | 97 days |