Analysis and insights of our water data
We analyse water related data to produce insights and information about water management. The department then uses the information and insights to manage water more effectively.
Data dashboards
Data visualisation tool to view and analyse water availability announcements.
Historical water usage across different regions within NSW, presented by water source, licence category and river section.
A summary of held environmental water shares, usage and trade data.
Generate water source and water sharing plan report for environmental water entitlements.
Search environmental held water trades between licences.
Historical water utilisation and activation rates by water source.
Share component since the commencement of the water sharing plan by water source and licence category.
Regional local water utilities can use the online performance monitoring database to annually report water supply and sewerage data, and
Find out more about how extractions are tracking against extraction limits in inland groundwater sources.
Water accounting rules by licence category for each regulated water source.
Catchment based annual analysis
We produce annual reports for each catchment that provide insights into:
- Climatic conditions (How did the annual reporting period compare to historical conditions?)
- Water resources (How much water was there?)
- Water resource changes (Where did the water originate and where did it go?)
- Water resource commitments (How was the water distributed amongst stakeholders?)
- Water resource use (How much entitlement is active and what proportion of available water is being used?)
- Environmental water (How much water was available for environmental use, and how much was delivered to environmental assets?)
- Water resource management (What legislative rules determined the sharing of available water?)
- Water market activity (How much water is being traded, and how much does the water cost?)
View the reports - NSW General Purpose Water Accounting Reports
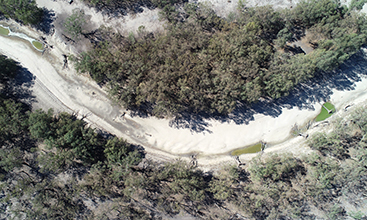
Find out more about the climate cycles and cease to flow periods for the last 130 years in the Barwon-Darling region.
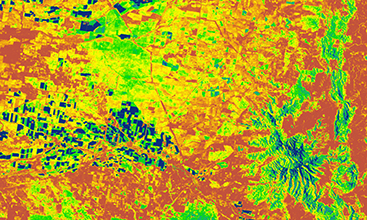
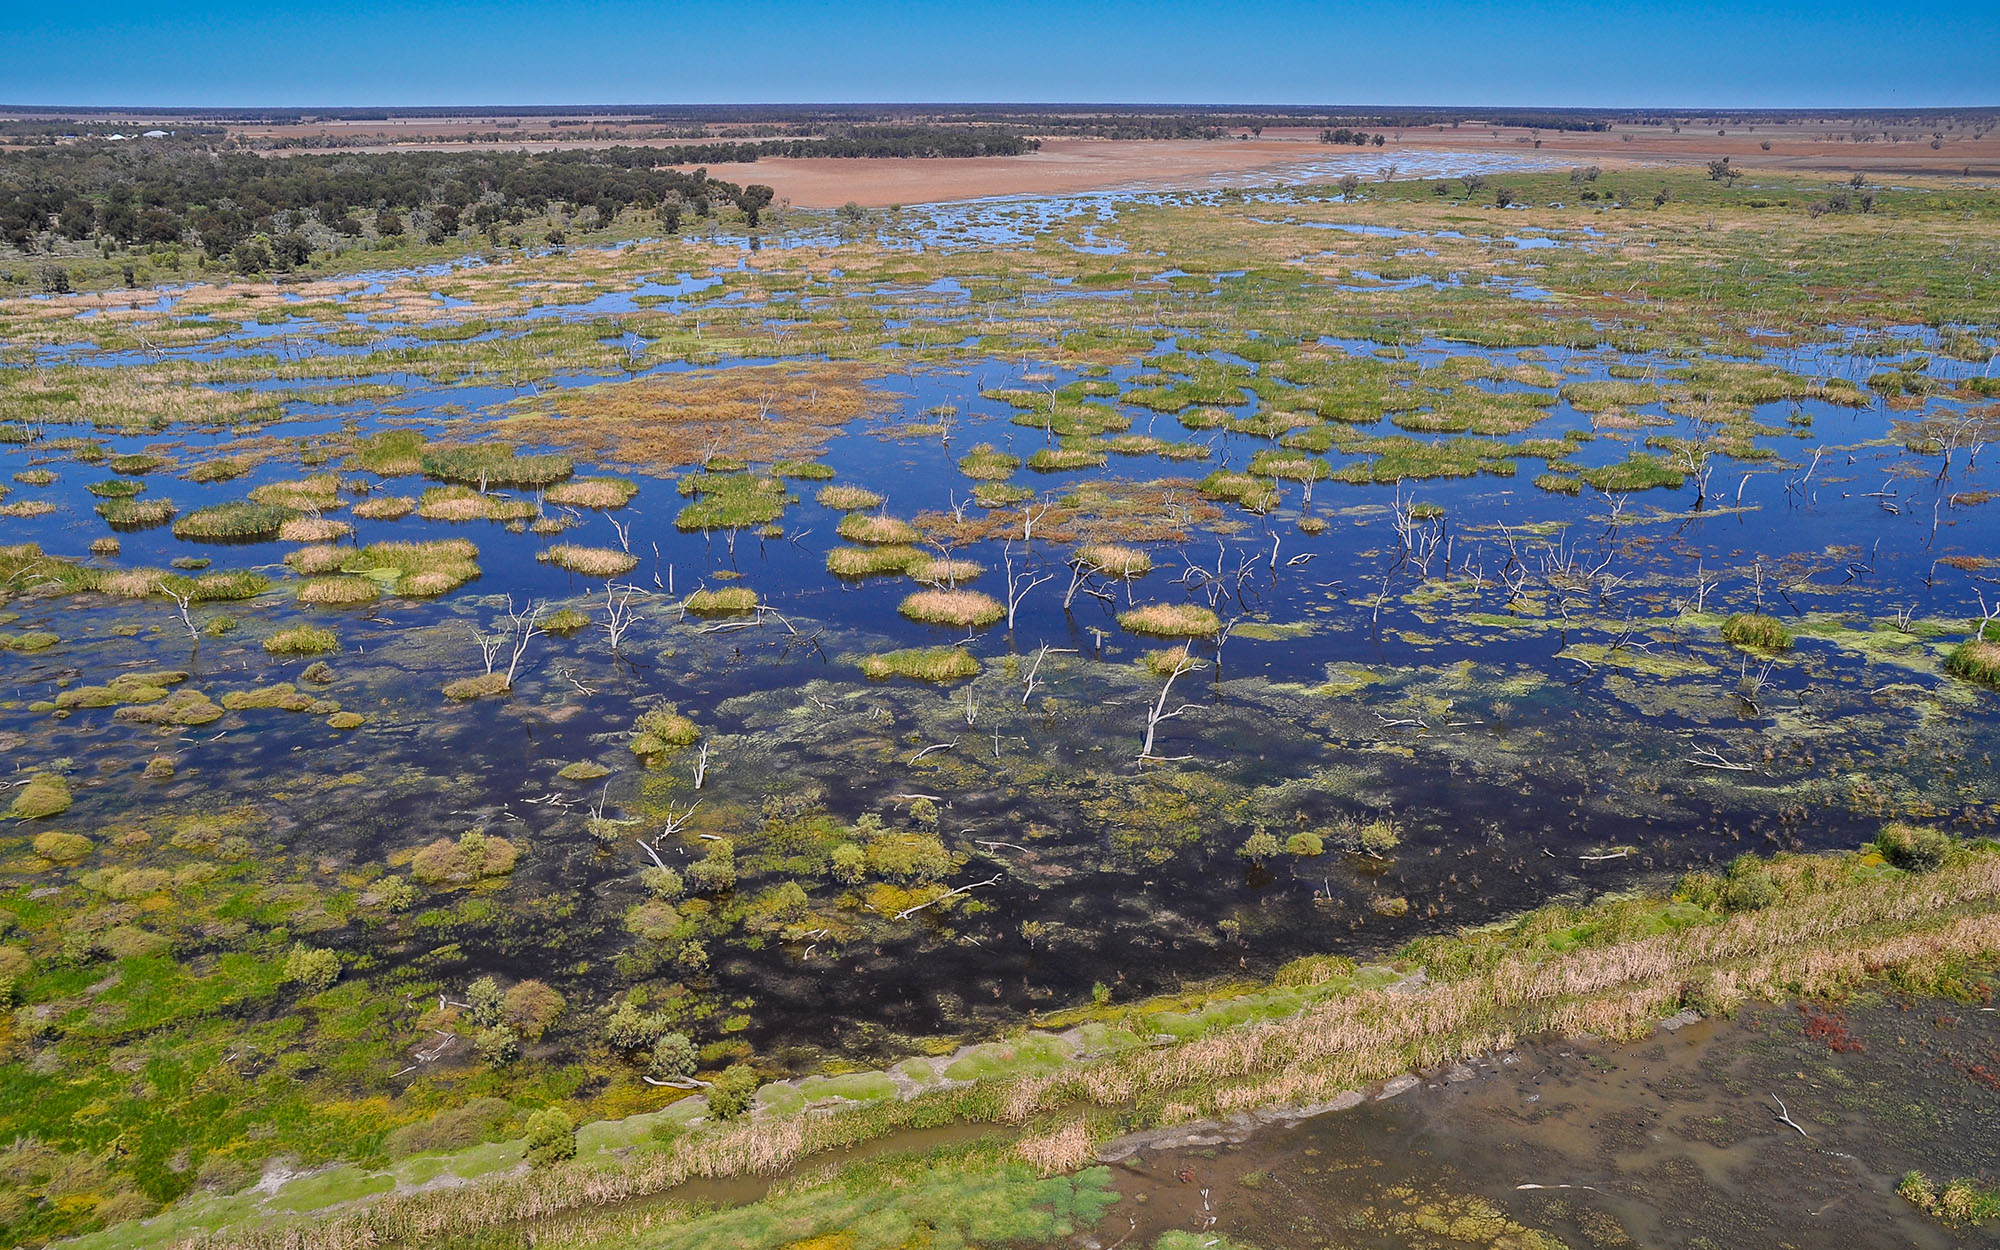
We use remote sensing technology to estimate water taken during flow events.